How to Calculate the True ROI of Warehouse Automation
5 Keys to Making a Case for Your Automation Project
22 min read
60-Second Summary
Calculating the true ROI of warehouse automation involves more than traditional financial metrics like payback period, NPV, and IRR. Effective ROI analysis must also consider qualitative factors such as increased productivity, reduced labor dependency, space optimization, improved service levels, and market competitiveness. Successfully justifying warehouse automation investments requires comprehensive financial evaluation alongside strategic considerations, ensuring the project delivers both immediate cost savings and long-term business value.
Introduction
Warehouse automation has become a critical investment for companies operating warehouses and distribution centers (DCs). With ongoing labor shortages, rising operational costs, and increasing customer expectations for faster fulfillment, businesses are under pressure to enhance efficiency while maintaining flexibility. As a result, automation is no longer just an option. It’s a necessity for staying competitive.
However, despite its clear advantages, the high cost of warehouse automation often raises questions about return on investment (ROI). Many companies assess ROI using traditional financial metrics such as payback periods, net present value (NPV), and internal rate of return (IRR). While these calculations are important, they don’t always capture the full value of automation. Factors such as increased productivity, improved accuracy, reduced labor dependency, and long-term scalability must also be taken into account.
This eBook will:
- Explain key methods for calculating ROI in warehouse automation
- Explore a broader perspective on ROI beyond financial metrics
- Discuss often-overlooked factors that influence ROI
- Show how to build a compelling business case for automation
“The global warehouse automation market was valued at approximately $19.23 billion in 2023 and is projected to grow at a compound annual growth rate (CAGR) of 18.7% from 2024 to 2030, reaching an estimated $57.09 billion by 2030.”
Grand View Research, “Warehouse Automation Market Size & Trends”
Chapter 1
Making the Case for Warehouse Automation
Before diving into ROI calculations, it’s important first to understand why they matter. In some cases, ROI may not even be a deciding factor. A CEO might be eager to adopt a particular technology, bypassing the need for financial scrutiny. In other situations, automation could be seen as an obvious win, with overwhelming financial and operational benefits that make project approval swift and uncontested.
However, in most organizations, securing approval for warehouse automation is far more complex. Multiple initiatives compete for the same pool of capital, and executives must make difficult decisions about where to allocate resources. The CEO and Board of Directors seek input from leadership teams, while the CFO requires a well-supported ROI analysis to justify the investment. Additionally, outside investors expect a clear path to returns before greenlighting significant expenditures.
Every company approaches capital investments differently. Startups flush with venture funding may be more willing to take risks, while established enterprises juggle multiple priorities. Consider a typical scenario: the Director of IT advocates for a major software upgrade, the Transportation Manager insists on expanding the fleet to meet demand, the Purchasing Team requires additional budget to secure more inventory, and the R&D Department is pushing for funding to develop the next breakthrough product. Warehouse automation is just one of many initiatives fighting for approval. To win internal support, it’s crucial to demonstrate why automation should take priority.

Decision-makers need to understand how automation will drive business value. The key questions to address include:
- Will it enhance customer service levels and expedite order fulfillment?
- How will it enhance employee productivity and job satisfaction?
- What measurable impact will it have on the company’s bottom line?
ROI analysis plays a critical role in answering these questions. By quantifying benefits such as cost savings, efficiency gains, and risk reduction, executives can objectively compare warehouse automation against other competing projects. A strong, well-supported business case significantly increases the likelihood of securing budget approval and advancing the project.
Chapter 2
Who Is Responsible
SHORT ANSWER: Operations should take the lead on calculating ROI.
While the Finance team has analysts who specialize in complex ROI calculations, they typically do not have a direct stake in whether an automation project gets approved. More importantly, financial analysts may lack firsthand knowledge of warehouse operations and the less tangible benefits of automation that go beyond standard financial metrics.
Automation projects necessitate a collaborative effort across various departments. The IT department plays a crucial role in integrating equipment controls with the warehouse management system (WMS) or enterprise resource planning (ERP) system. Human Resources may also need to revise workforce planning in response to evolving labor demands. Additionally, other departments may experience changes in service levels and production expectations.
A well-structured business case backed by a clear ROI analysis not only strengthens the project’s justification but also helps build consensus among key stakeholders. By demonstrating both financial and operational benefits, the organization can move one step closer to securing approval and successfully implementing automation.
Chapter 3
What Should ROI Measure?
ROI begins with financial calculations, but it also includes other factors that are not always easy to quantify. A comprehensive approach to ROI considers both measurable financial returns and qualitative benefits that require a more creative assessment.


The most common financial metrics used in ROI calculations include simple payback, net present value (NPV), and internal rate of return (IRR). While these figures provide a clear financial picture, automation offers additional advantages that may not fit neatly into traditional formulas. For example, labor cost reductions are straightforward to calculate; however, the financial impact of space savings from a goods-to-person system, improved service levels, lower damage rates, and enhanced order accuracy due to reduced human handling can be more challenging to quantify.
Even if certain benefits cannot be directly measured in monetary terms, they should still be taken into account in the decision-making process. If two competing projects have similar financial ROI, the one with stronger overall business value, including qualitative improvements, should take priority. That’s why it’s essential to evaluate every possible improvement and make a strong effort to quantify even those factors that seem intangible. In many cases, these qualitative benefits are just as important, if not more, than the direct financial return on investment

Chapter 4
The Three Methods of Calculating Financial ROI

Simple Payback
Simple payback serves as a quick litmus test before conducting more detailed ROI analyses. It is calculated by dividing the total capital expense by the expected annual cash flow or cost savings. If the resulting payback period exceeds the company’s internal thresholds, it may not be worthwhile to perform more in-depth calculations.
However, many organizations set payback periods that are significantly shorter than the actual lifespan of automation equipment. For example, while a two- to three-year payback period is common, most automation systems last over a decade. Dismissing a project solely because it slightly exceeds the payback threshold may overlook long-term benefits.

Net Present Value (NPV)
NPV is the most widely used financial metric for evaluating ROI. Unlike simple payback, NPV accounts for the time value of money, considering both the cost of capital (hurdle rate) and multiple years of projected cash flows.
By discounting future cash flows to their present value, NPV provides a more accurate picture of a project’s overall financial impact. A positive NPV indicates that the investment will generate returns above the hurdle rate, making it a strong candidate for approval. A negative NPV suggests that the project would yield a lower return than simply investing the funds elsewhere.

Internal Rate of Return (IRR)
IRR is similar to NPV in that it considers the cost of capital and multi-year cash flows. However, instead of yielding a dollar amount, IRR expresses the return as a percentage, similar to how personal investment portfolios display returns over different timeframes (e.g., 3-year, 5-year, or 10-year returns).
IRR is the rate at which NPV equals zero. If the IRR is higher than the company’s hurdle rate, the project is considered financially viable. When multiple projects compete for the same budget, those with the highest NPV or IRR are typically prioritized for approval.
Time Value of Money
Both NPV and IRR rely on the fundamental principle of the time value of money: A dollar today is worth more than a dollar in the future. These methods incorporate the cost of capital and investment timeframe to determine the present value of a project.
Three key financial concepts are used in NPV and IRR calculations:
- Future value – The projected worth of money if invested or loaned over time.
- Present value – The initial cost of the project in today’s dollars.
- Required rate of return (hurdle rate) – The minimum return a project must achieve to be considered viable.
The required rate of return depends on the company’s cost of capital and the number of competing initiatives. In many cases, businesses apply a higher hurdle rate for projects involving newer or unproven technologies to offset potential risks.
Numbers You’ll Need
CAPITAL EXPENSE
Cost of the project, including equipment, installation, freight, taxes, and future maintenance/software license fees.
Depreciation and amortization costs may also be included.
CASH FLOWS
(savings)
Generated by the investment.
COST OF CAPITAL
(rate of return or hurdle rate).
This is usually the rate a company pays its long-term investors.
Chapter 5
Cash Flow Considerations
The next step in ROI analysis is to calculate the project’s cash flow over the expected timeframe, typically three to five years. Some cash flows may increase over time, such as labor costs affected by inflation or wage hikes. In these cases, the ROI is expected to improve in future years as the accumulated cost savings are realized.
Automation projects typically impact three key cash flow categories: labor, space, and increased revenue
Labor Savings
To estimate labor savings, compare current productivity levels with projected productivity after automation, using fully loaded wage rates that include benefits and payroll taxes. The difference between these two states represents the annual cash flow savings.
However, many businesses overlook additional labor-related costs. If automation reduces headcount, it’s essential to consider the full cost of employment, encompassing not only wages but also other expenses. These include expenses for recruitment, training, and retention, as well as liability costs related to worker injuries or lawsuits. Reliability costs—such as lost productivity due to absenteeism, injuries, tardiness, or performance inconsistencies—should also be included. A comprehensive assessment of labor costs ensures a more accurate ROI calculation.
As of December 2024, the average hourly earnings for production and nonsupervisory employees in the U.S. warehousing and storage sector were $24.00 per hour. This figure represents a slight increase from the previous year, reflecting ongoing wage growth in the industry. bls.gov
In comparison, the average hourly wage for all employees on private nonfarm payrolls in the United States stood at $30.89 in February 2025. This suggests that while warehouse workers earn less than the national average, their wages have been increasing steadily over time. statista.com
These trends underscore the increasing demand for warehouse workers and the industry’s efforts to attract and retain talent through competitive compensation packages.
Space Savings
Automated storage and retrieval systems (ASRS) and other goods-to-person solutions optimize cubic storage, significantly improving space utilization compared to conventional shelving or carton flow racks.
Space is a valuable asset, with costs including rent, utilities, and maintenance. By maximizing the use of existing warehouse space, companies can delay or eliminate the need for expensive facility expansions. In some cases, businesses may even generate revenue by subleasing unused space or returning it to the landlord. Factoring these savings into ROI calculations provides a clearer picture of the financial impact of automation.
E-commerce still required three times the logistics space of in-store sales in 2024. This ratio has remained relatively stable for a decade, driving demand for logistics real estate even as operations continue to evolve.
U.S. e-commerce penetration is projected to reach 30% by 2030, up from its current level of 24%. This share shift alone would produce a total of 250 to 350 million square feet of U.S. logistics space demand over the next five years.
These trends underscore the critical need for expanded logistics infrastructure to support the evolving demands of e-commerce and supply chain strategies.
Increased Revenue
Beyond cost savings, automation can also drive revenue growth. Faster shipping, improved order accuracy, and enhanced service levels strengthen competitive advantage and reduce customer service complaints, returns, and refunds.
Satisfied customers lead to repeat business, positive reviews, and increased brand loyalty, all of which contribute to higher cash flow. Factoring these revenue gains into ROI calculations enhances payback estimates, NPV, and IRR, thereby strengthening the case for investing in automation

Chapter 6
Doing the Math
A company is considering a $3,000,000 automation investment on a goods-to-person picking system with the following factors:

COST OF AUTOMATION
$3M

BENEFITS
Space utilization/Storage
Lower labor costs

SAVINGS
$1.3M/year

RATE OF RETURN
(Hurdle Rate)
8%
- Cost of Automation: $3M
- Benefits: Space utilization/Storage/Lower labor costs
- Savings: $1.3M
- Rate of Return (Hurdle Rate): 8%
Simple Payback
The focus of the payback analysis is on the time required from the project to return the original investment. To do the calculation, divide the capital expense by the annual cash flow or savings.
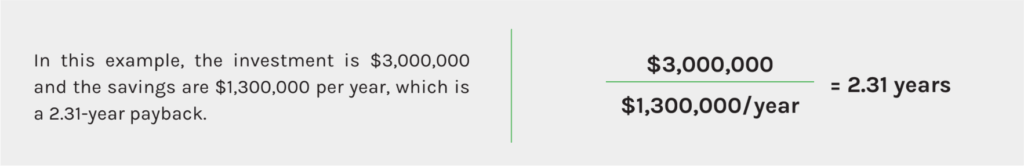
While payback period thresholds vary by company, the true measure is whether the payback period is shorter than the equipment’s life. Here, the payback is within the threshold of the three-year equipment life.
Note that most companies establish payback thresholds significantly shorter than the actual lifespan of the equipment, which means this method may not accurately reflect the true financial benefits of automation. NPV and/or IRR may reveal a project to be beneficial, even if it has a higher payback period.
Net Present Value
Considered by many to be the true indicator of a project’s financial benefit, NPV takes into account the time value of money and the cost of capital.
When calculating NPV, first calculate the present value, which is the sum of the future values (or cash flow savings) divided by 1 plus the hurdle rate. For each period beyond the first year, the hurdle rate is squared or cubed. This calculation is available in Excel. Since NPV considers both the hurdle rate and the time periods (or the time value of money), the future values become less valuable. To calculate the NPV over five years, calculate two additional periods of present value, as shown in the following example.
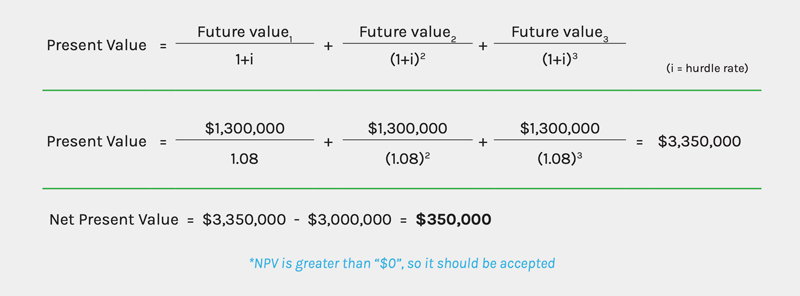
In the example, the NPV is $350,000, which is greater than zero; therefore, this investment exceeds the 8% hurdle rate of return. The project would yield an additional $350,000 in three years, compared to investing the funds at 8%.
Internal Rate of Return
The IRR is the interest rate where the NPV equals zero. The IRR calculation reveals gross savings over a period, making it the preferred method for comparing the return rates of various investments or projects.
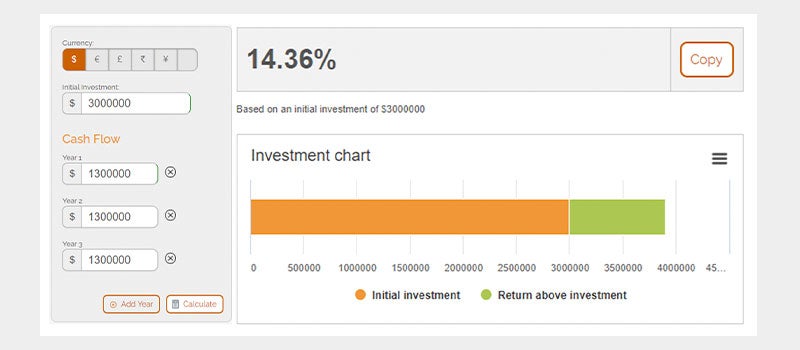
In this example, the IRR for the automation project is 14.36%. Since the hurdle rate is 8%, the project should be accepted.
Selecting the Right ROI Method for Your Project
There is no single method that is better than the others; it all depends on the project, audience, and available budget. If the project is a large capital expense or if there is significant competition for the budget, use all three methods to demonstrate the best possible ROI.
Start with the simple payback method. If the payback period is too long, either abandon the project or negotiate to reduce the capital expense.
If the payback period is less than the actual life of the equipment (not the self-imposed payback threshold), calculate IRR. The payback threshold may be negotiable, so it’s important to consider alternatives to the simple payback method. For example, most executives would approve a project with a 25% IRR, even if it had a simple payback of four years.
Finally, using NPV reveals the gross savings, which may be a better way than percentages to evaluate competing projects. While an investment with a 40% IRR may yield only $50,000, a project with a 25% IRR could produce $500,000 in return. The available budget will ultimately determine approval, but the greater amount of savings would generally be most appealing to an executive team.

Chapter 7
Additional Factors to Include in the Business Case
After calculating the financial ROI, it’s essential to consider qualitative factors that, while harder to quantify, can be just as critical in securing project approval. A strong business case goes beyond the numbers—these additional factors can make or break the final decision.

Service Levels: Automation doesn’t just increase productivity; it also expands capacity and accelerates processing speeds—sometimes by a factor of 10 or more. Faster order processing translates to quicker customer deliveries, which in turn improve service levels and overall customer satisfaction.

Order Profiles & Product Characteristics: Even if an automation solution delivers a strong financial ROI, it must be compatible with your company’s order and product types. If the system cannot handle a significant portion of the inventory due to its size, weight, or SKU complexity, it may limit operational flexibility and reduce the expected savings.

Building Specifications: Before implementation, it’s important to evaluate facility constraints. Is there adequate space for the new equipment, or will process flows need to be redesigned? How will the automation integrate with existing warehouse layouts and workflows? Addressing these questions upfront can prevent costly redesigns later.

Technology & Integration: Most automation solutions require seamless integration with existing ERP, WMS, or WCS/WES systems. Ensuring compatibility and smooth data exchange is critical but can sometimes require extensive development efforts. The ability of an automation system to integrate effectively with existing infrastructure should be carefully assessed.

Human Factor: Highly automated systems require skilled operators. Consider the expertise of your current workforce—are supervisors, managers, and maintenance teams tech-savvy, or will they need extensive training? Additionally, what level of support does the equipment vendor provide, and will it be sufficient to maintain uptime and operational efficiency?

Prestige & Market Perception: Adopting cutting-edge automation can position your company as an industry leader, signaling innovation to customers, partners, and investors. If securing additional funding or establishing a reputation for technological leadership is a priority, automation can serve as a valuable asset in strengthening your company’s market position.
By incorporating these qualitative factors into the business case, companies can build a more compelling argument for automation, increasing the likelihood of project approval.

Conclusion
Are You Ready?
Whether you’re considering co-bots, goods-to-person systems, robotic picking, or a combination of automation solutions, securing approval for the investment requires a solid business case and a well-supported ROI calculation. Without these, the project is unlikely to move forward.
Recap: The Five Keys to Calculating Automation ROI
- Identify the challenges driving the need for automation and quantify their impact—this lays the foundation for a compelling ROI analysis.
- Understand your company’s investment priorities and competing projects. Calculate the ROI before approaching Finance to strengthen your case.
- Use a structured approach to ROI calculations, starting with simple payback, then expanding to NPV and IRR for a more comprehensive financial justification.
- Consider both quantitative and qualitative factors, ensuring that operational efficiencies, workforce impacts, and customer experience improvements are thoroughly analyzed.
- Partner with an experienced automation provider that has a strong track record of guiding similar companies through successful deployments.
By collaborating with industry experts who understand the financial, business, and IT challenges—while offering proven automation solutions—you’ll increase leadership buy-in and pave the way for a successful implementation.
Other Resources You Might Find Helpful
Perfect Pick with Tote IO, Side Facing Tote Interface
Perfect Pick with Tote IO, Front Facing Tote Interface
Enhancing Document Processing and Efficiency With MLOCR Technology
Palm Beach County Tax Office
Automating Donation Processing for Nonprofits
Same-Day Delivery: Making It a Reality With Automated Sorting Systems
RMMI Streamlines Scanning Efficiency with OPEX® Falcon®+ One-Touch Scanners
Optimizing Your Warehouse Layout for Automation
Reducing Errors and Improving Accuracy With Automated Sorting in Logistics
Automating Invoice Processing for Energy Companies
NEXT LEVEL AUTOMATION
Unlock Operational Efficiency with OPEX
OPEX is powering the future of automation. Contact us to learn more about how our vertically integrated automated solutions can help take your business to new heights.